David Robinsons Functions
Data Visualization
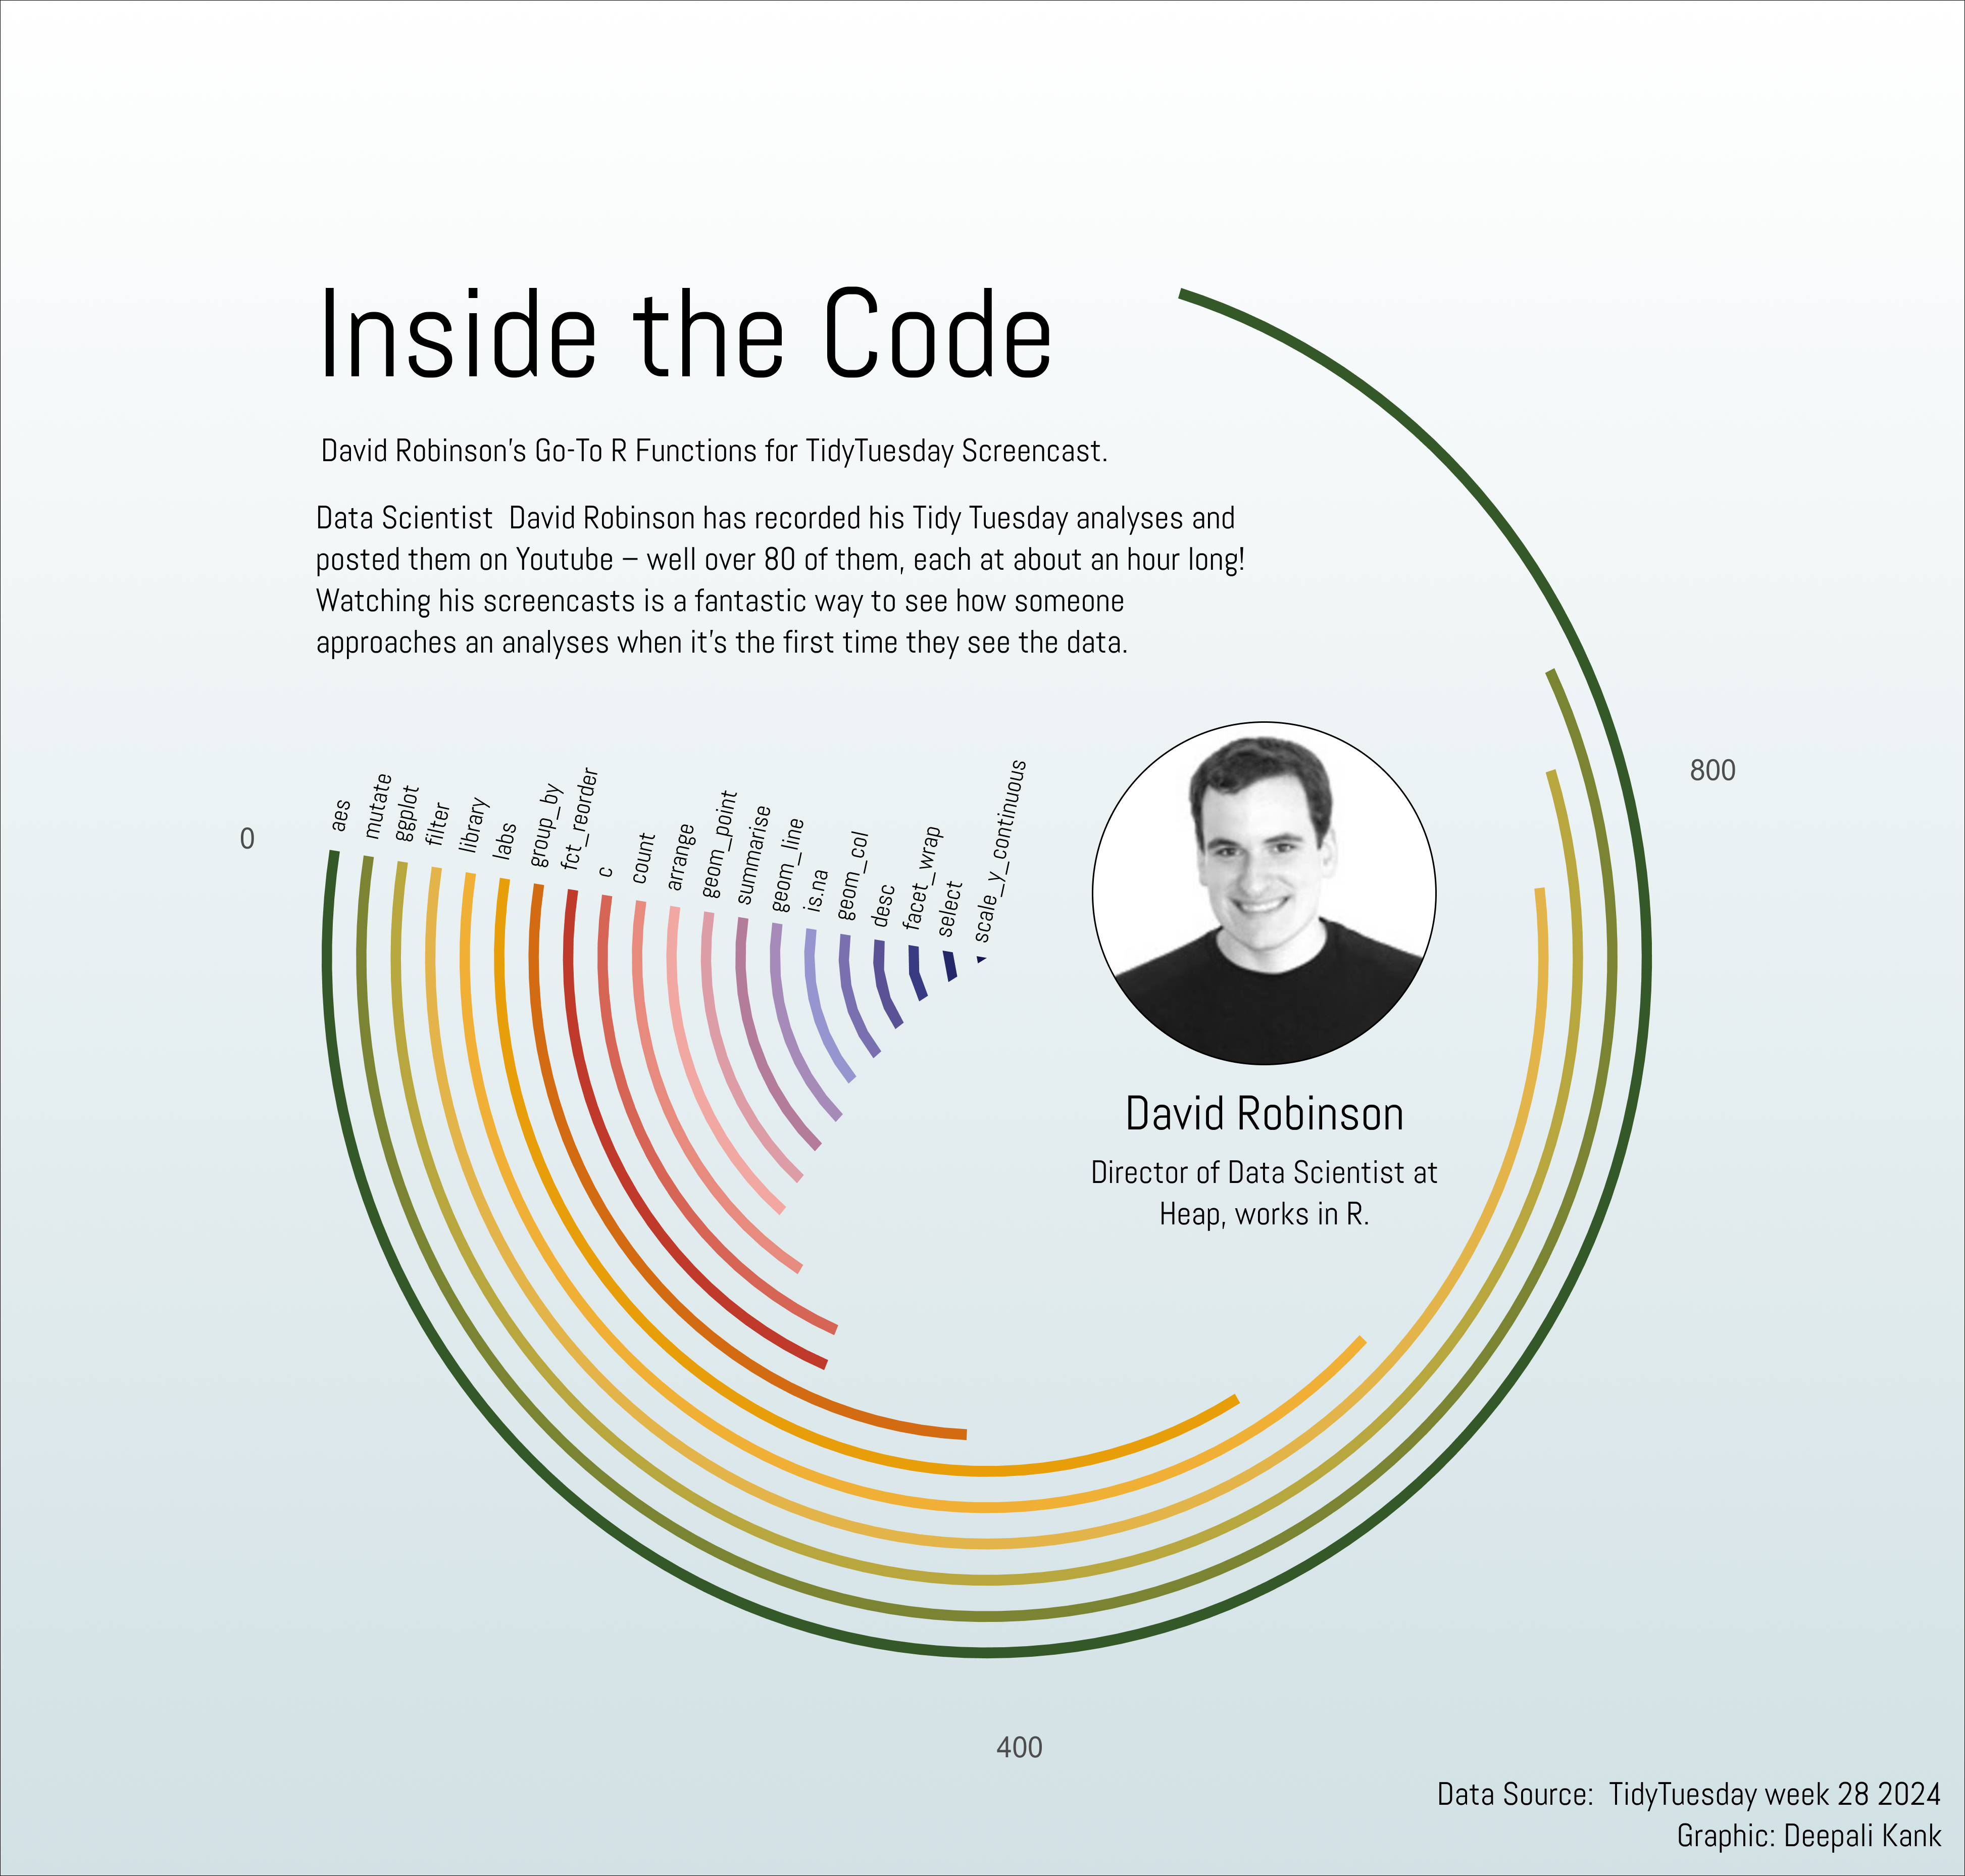
This week we’re seeing how David Robinson has explored TidyTuesday data in his YouTube screencasts! Thanks to Bryan Shalloway for the suggestion, the {funspotr} package, and the blog posts about how to use funspotr (including this one about making network graphs with the data).